 Industrial Solution Finder
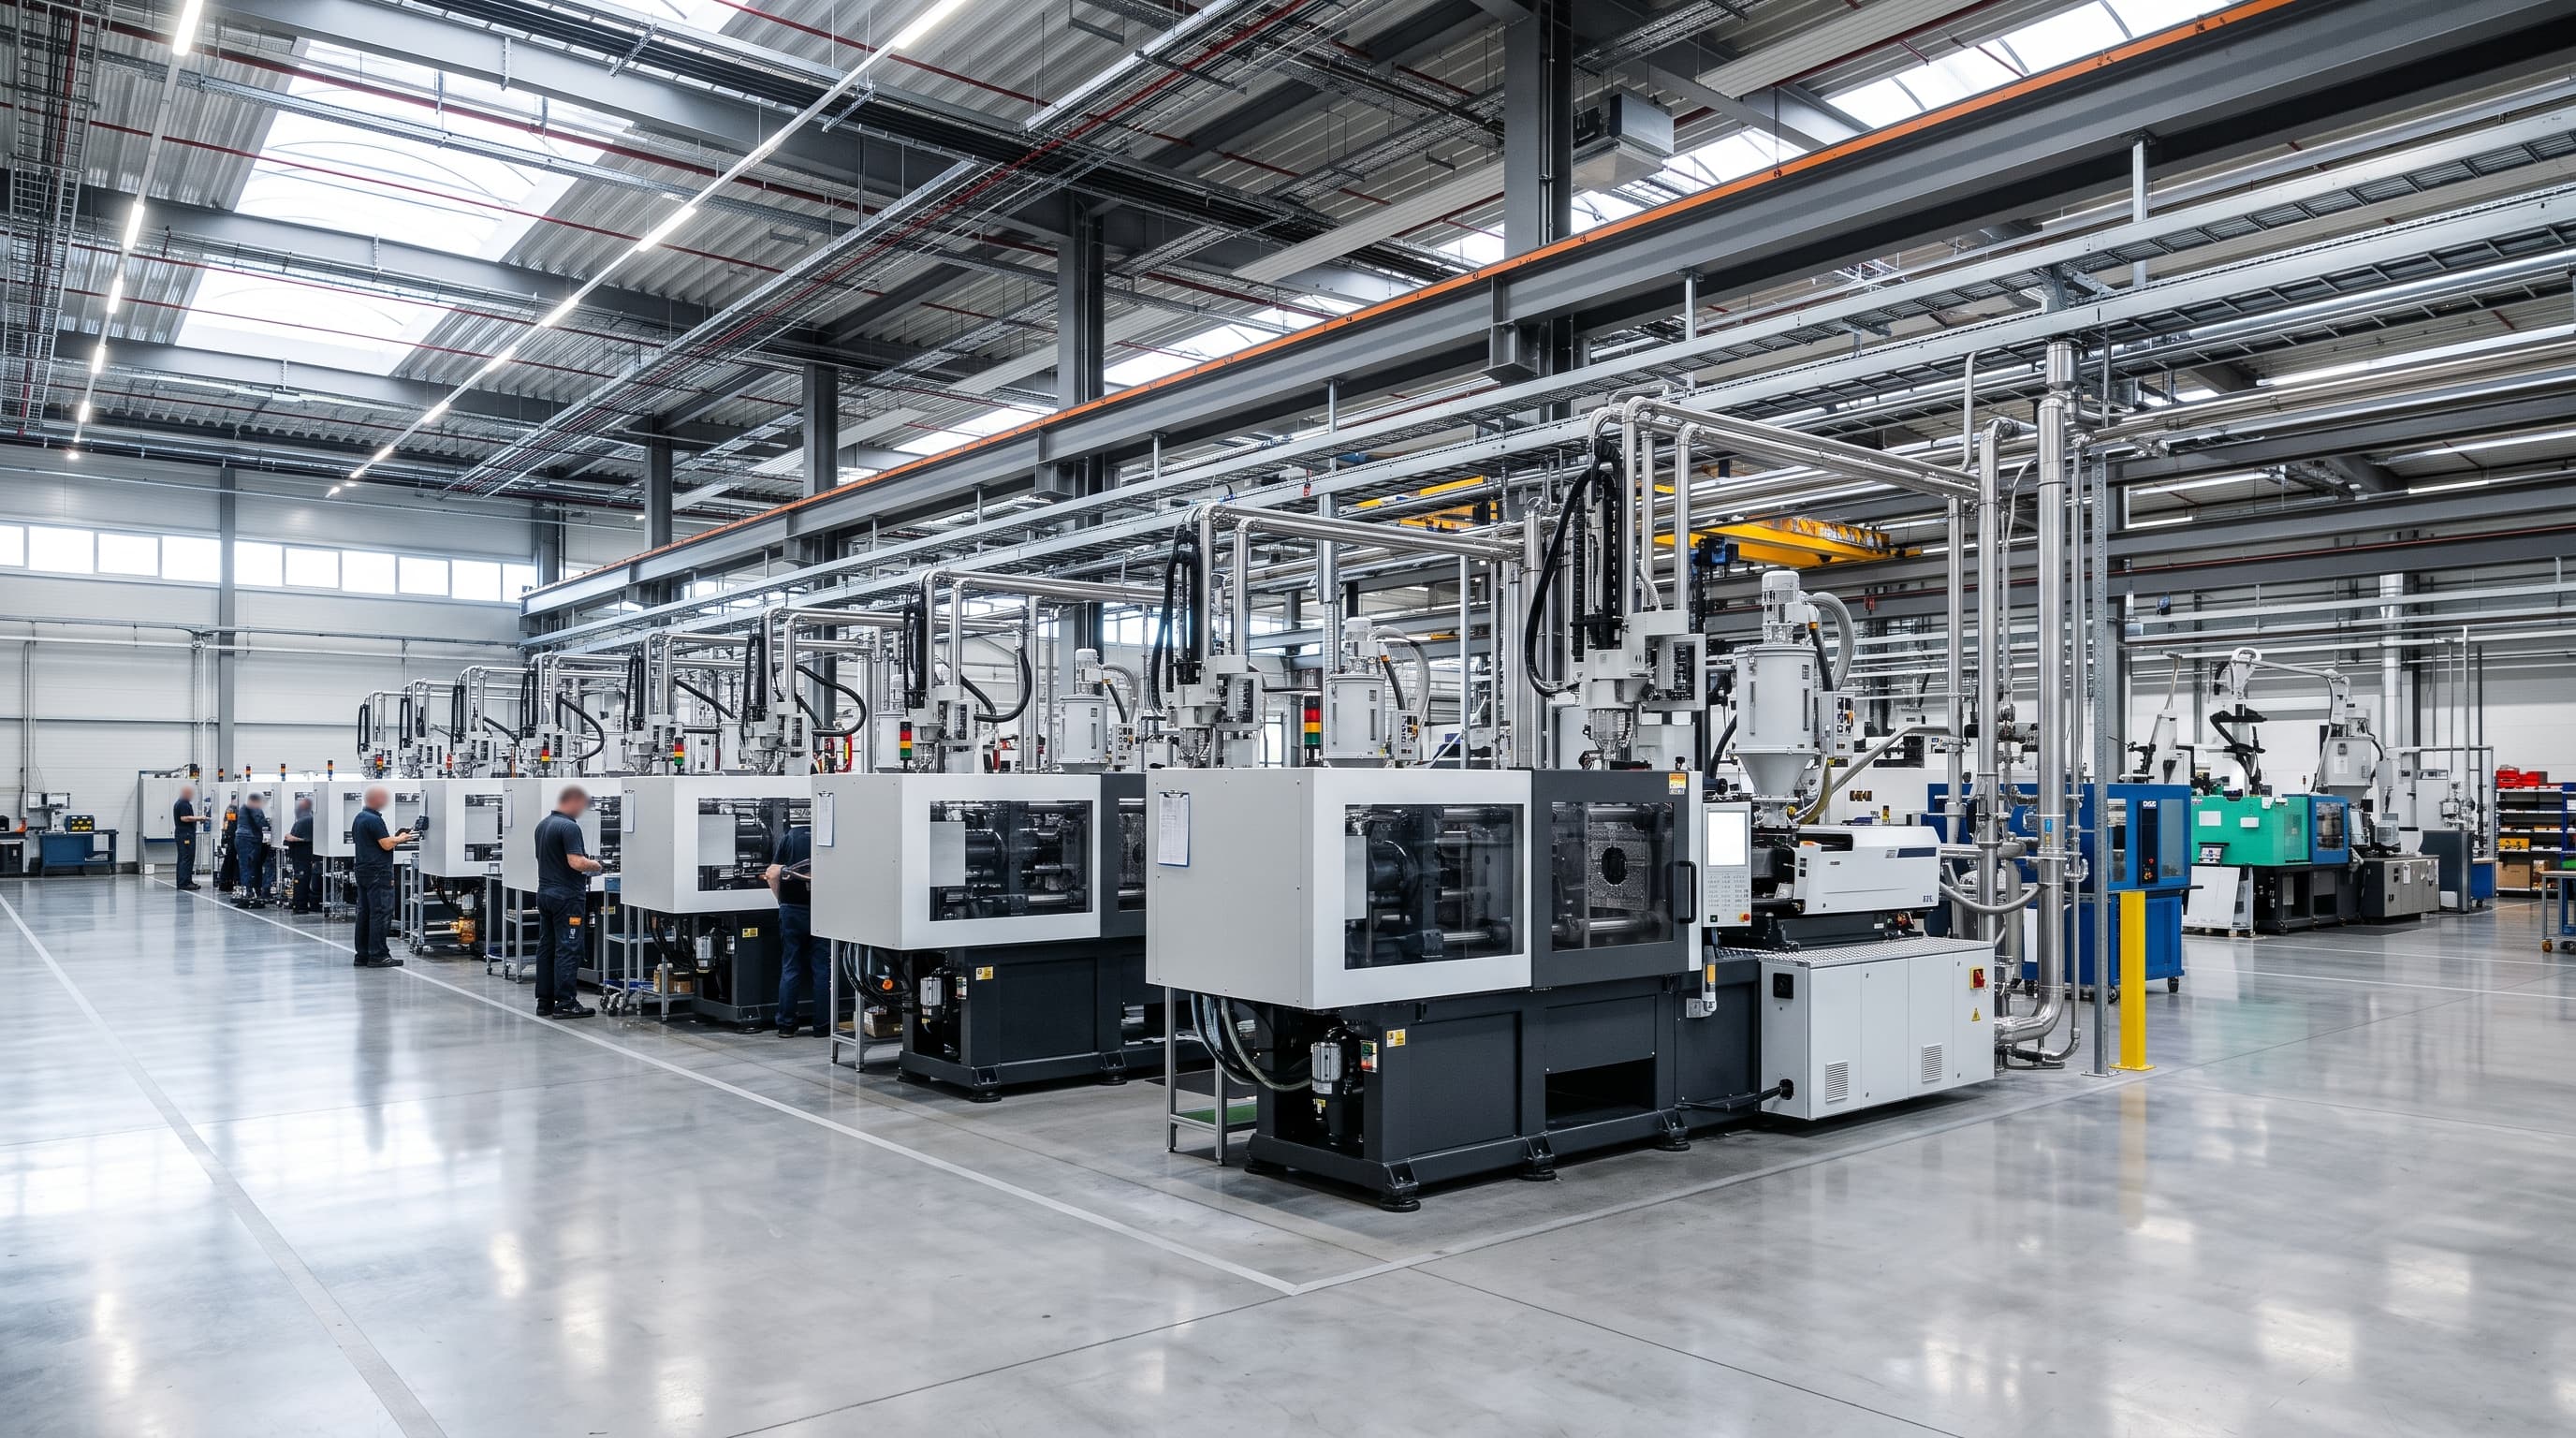
To calculate 5-year TCO, combine initial machine procurement with 5-year direct power draw, chiller cooling, hydraulic fluid upkeep, scrap losses, and residual equipment salvage value.
Evaluating equipment investments requires balancing initial capital expenditure against long-term plant operating costs. For mid-tonnage applications—specifically standard 200-ton injection molding presses running multi-cavity tooling—plant directors frequently debate whether the premium acquisition price of an all-electric press delivers a measurable return over traditional or servo-hydraulic machines. While machine catalogs highlight clamping speeds and theoretical energy ratings, long-term profitability depends on direct utility billing, auxiliary cooling overhead, preventive fluid servicing, and end-of-lifecycle salvage equity. This quantitative framework establishes a standardized five-year Total Cost of Ownership (TCO) baseline for plants operating across two or three continuous production shifts, isolating where mechanical efficiency translates into verified operating cash flow.
Core Components of the Injection Molding TCO Formula
A comprehensive five-year TCO model consolidates five primary variables: Capital Expenditure (net landed machine price, site rigging, and initial utility hookups), Direct Process Power (specific cycle consumption measured per kilogram of resin processed), Auxiliary Heat Dissipation (chilled water utilities required to manage drive heat), Consumables and Maintenance (hydraulic oil replacement, filter changes, and lubrication grease), and Part Scrap Variability (dimensional repeatability shifts across temperature swings). Mathematically, the calculation is represented as: Total Cost = CAPEX + 5 × (Annual Electricity + Annual Chiller Energy + Annual Maintenance + Annual Scrap Cost) - Equipment Salvage Value at Year 5. Neglecting any of these operating parameters skews capital planning, as recurring utility and maintenance expenses over 60 months frequently exceed initial procurement costs.
The international standard EUROMAP 60.1 provides an established methodological benchmark for isolating machine-specific energy consumption under defined cycling speeds and clamping forces. To avoid analytical distortions, plant engineers must isolate baseline machine consumption from uncontrolled ambient factory variables. This requires measuring baseline kilowatt-hour draw across identical resin grades, screw recovery back-pressures, barrel heating bands, and clamp dwell times. Establishing this controlled boundary ensures that calculated energy variances reflect actual electro-mechanical efficiencies rather than mold-design variances or resin melt index fluctuations.
Initial Capital Outlay and Procurement Differentials
Across the injection molding sector, general medium-tonnage machinery ranging from 100 to 300 tons typically spans from $50,000 to $200,000 depending on automation integration and performance tier2. When narrowing the evaluation specifically to standardized 200-ton production presses, capital expenditure presents a clear delta between drive architectures: industrial market benchmarks identify modern 200-ton servo-hydraulic machines at approximately $70,000 to $110,000, whereas comparable all-electric units range from $120,000 to $180,0001. This establishes an upfront acquisition premium of approximately 30% to 50% for all-electric platforms1.
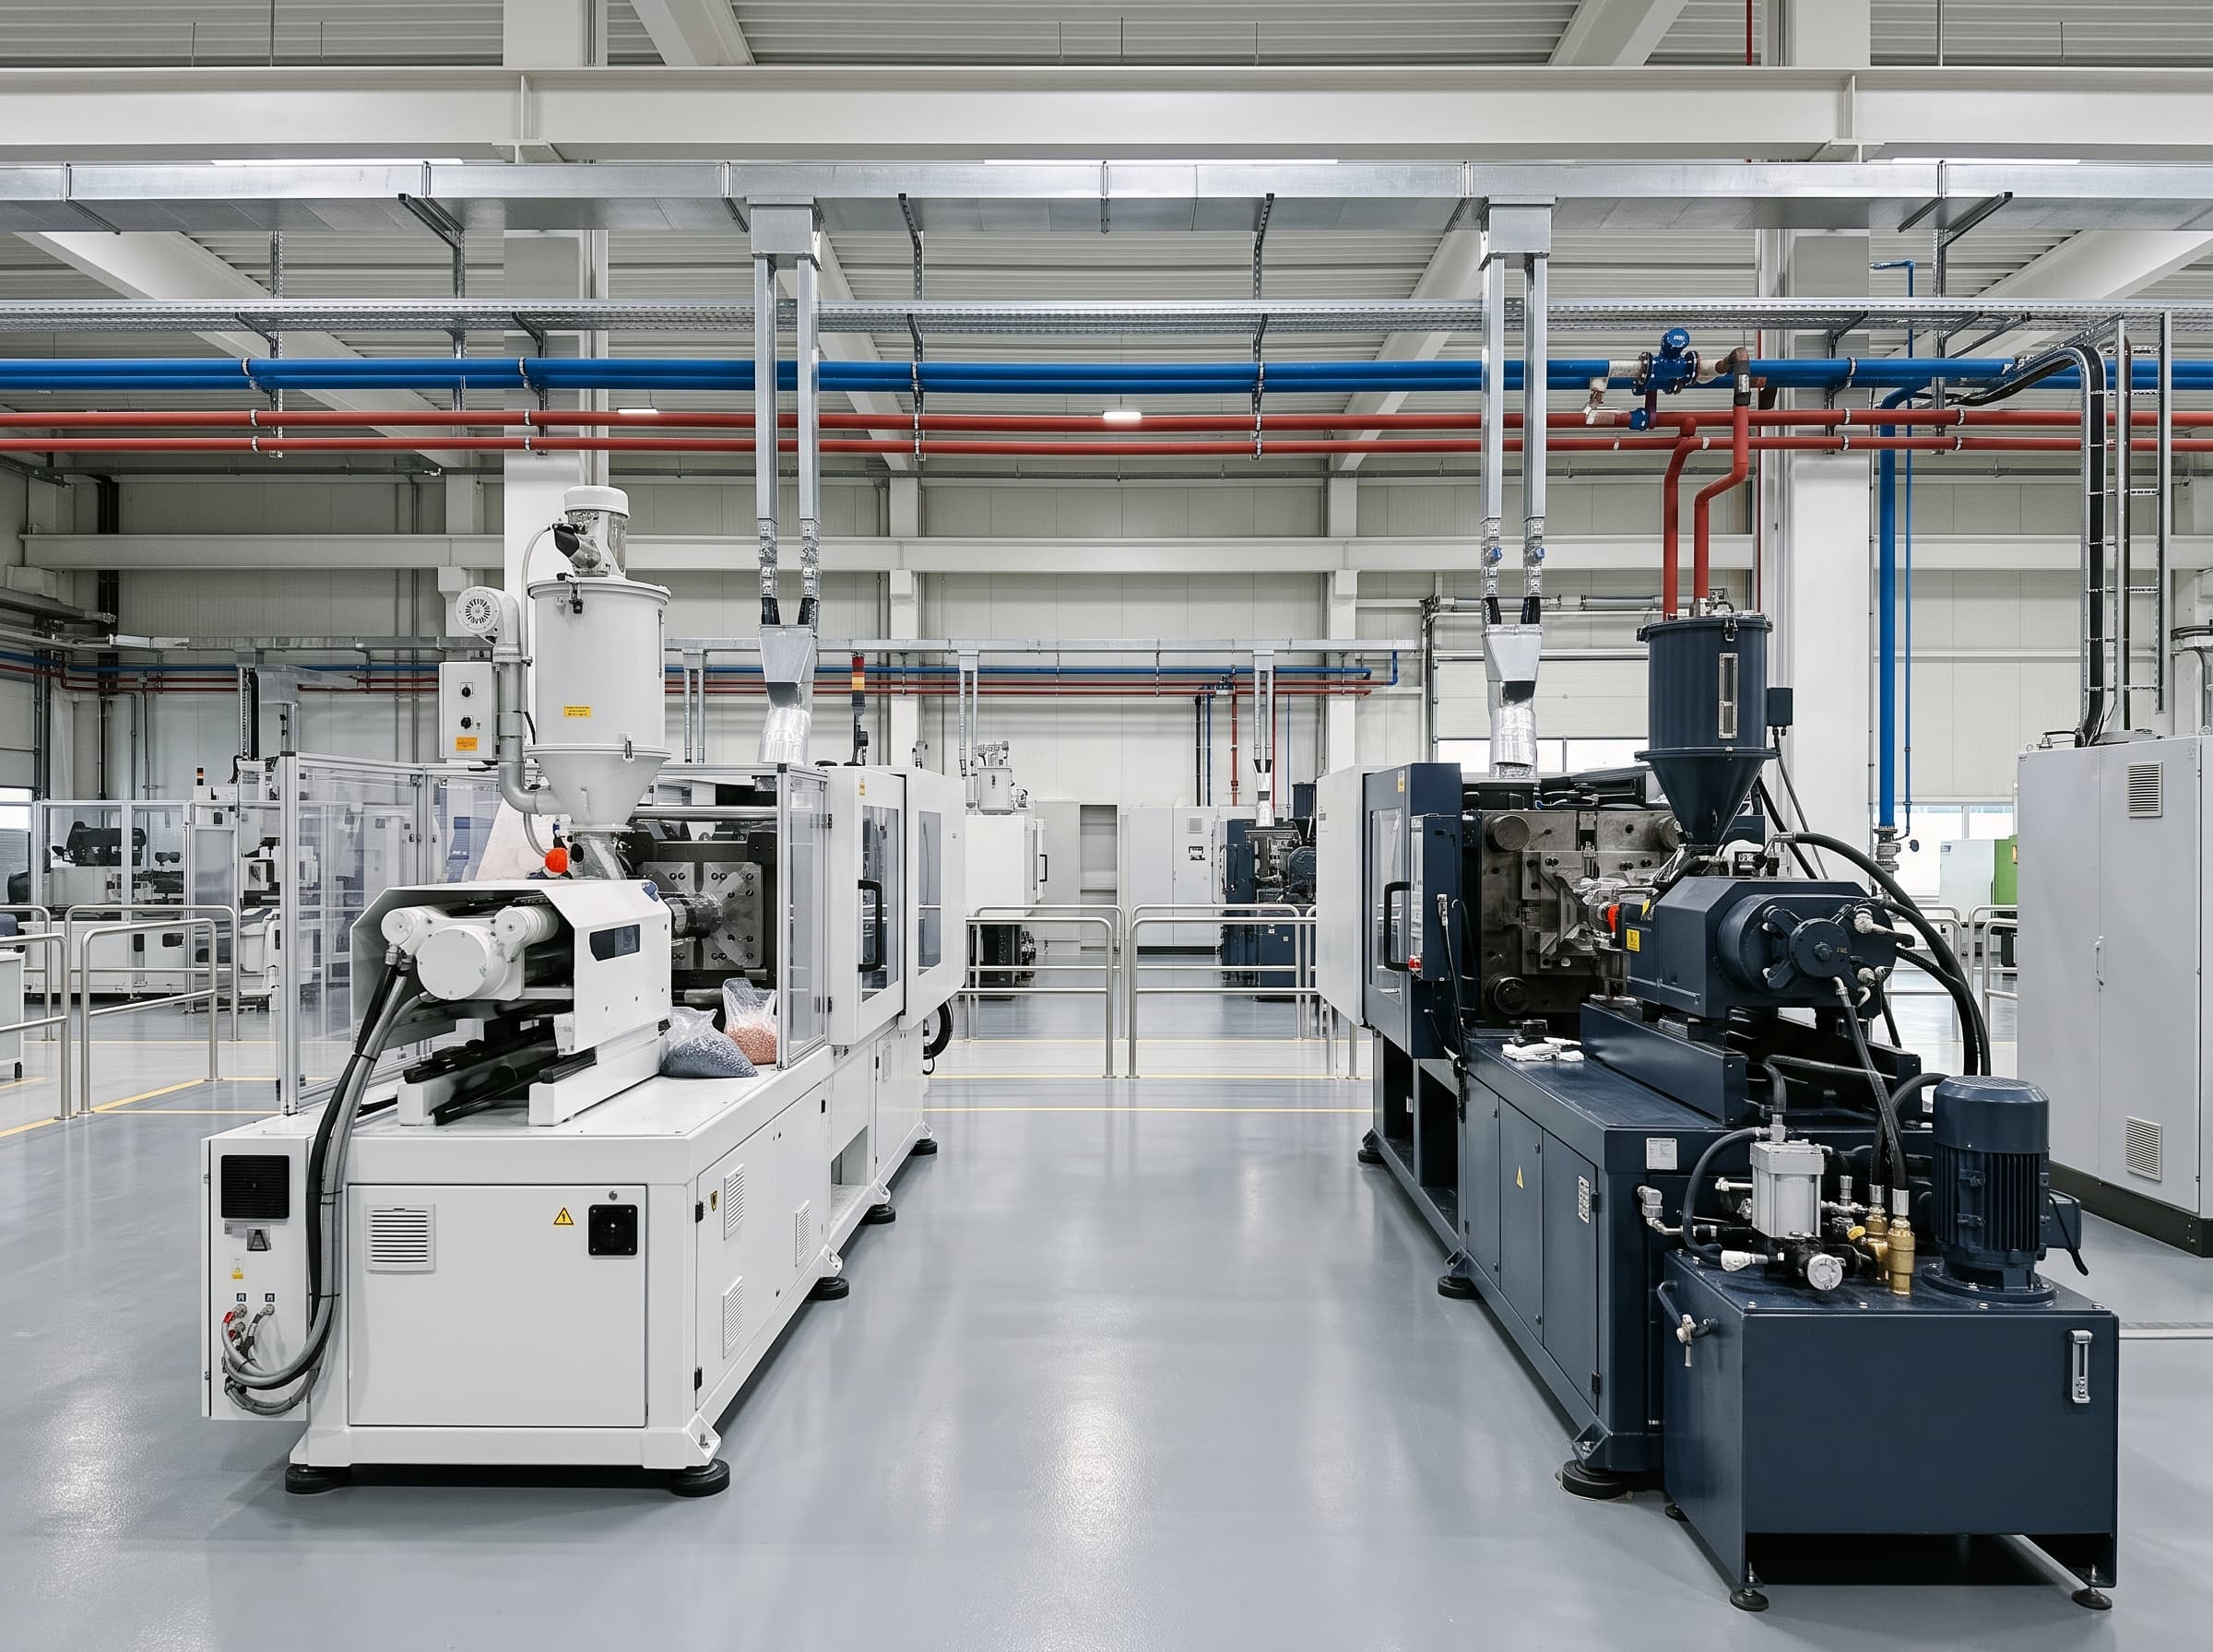
The capital comparison must also factor in commissioning requirements and facility integration costs. All-electric presses eliminate fluid reservoirs, pump skids, and catchment curbing, but they require dedicated electrical bus drops rated for high peak regenerative servo currents during rapid clamp deceleration. Conversely, servo-hydraulic systems require initial factory reservoir fills of specialized anti-wear hydraulic oil, secondary water manifold piping for oil heat exchangers, and fluid condition monitoring sensors before initial mold sampling can commence.
Direct Energy Consumption and Utility Heat Dissipation
Operational energy forms the primary financial lever offsetting the all-electric machine capital premium. Side-by-side technical performance evaluations confirm that all-electric machines consume between 0.30 and 0.45 kWh per kilogram of processed polymer, while modern servo-hydraulic systems consume 0.50 to 0.65 kWh/kg under equivalent cycling conditions1. Older, fixed-displacement traditional hydraulic systems burn 0.85 to 1.20 kWh/kg1. While servo-driven hydraulic pumps shut off or idle during non-movement stages to yield substantial energy reductions over legacy hydraulics, direct-drive electric servomotors deliver an additional 30% to 50% efficiency improvement by avoiding all hydraulic fluid throttling and transmission friction losses1.
Applying energy formulas requires local industrial electricity pricing. Published U.S. industrial retail electricity data benchmark average rates around $0.087 to $0.098 per kWh, with regional tariffs showing notable spreads3. On a facility running 6,000 operational hours per year at 50 kg/hour throughput (processing 300,000 kg annually), the efficiency differential between servo-hydraulic and all-electric architectures generates between $8,000 and $15,000 in direct annual electricity savings for mid-scale molding operations1. Over five operating years, this recurring power reduction amortizes a major share of the machine price spread.
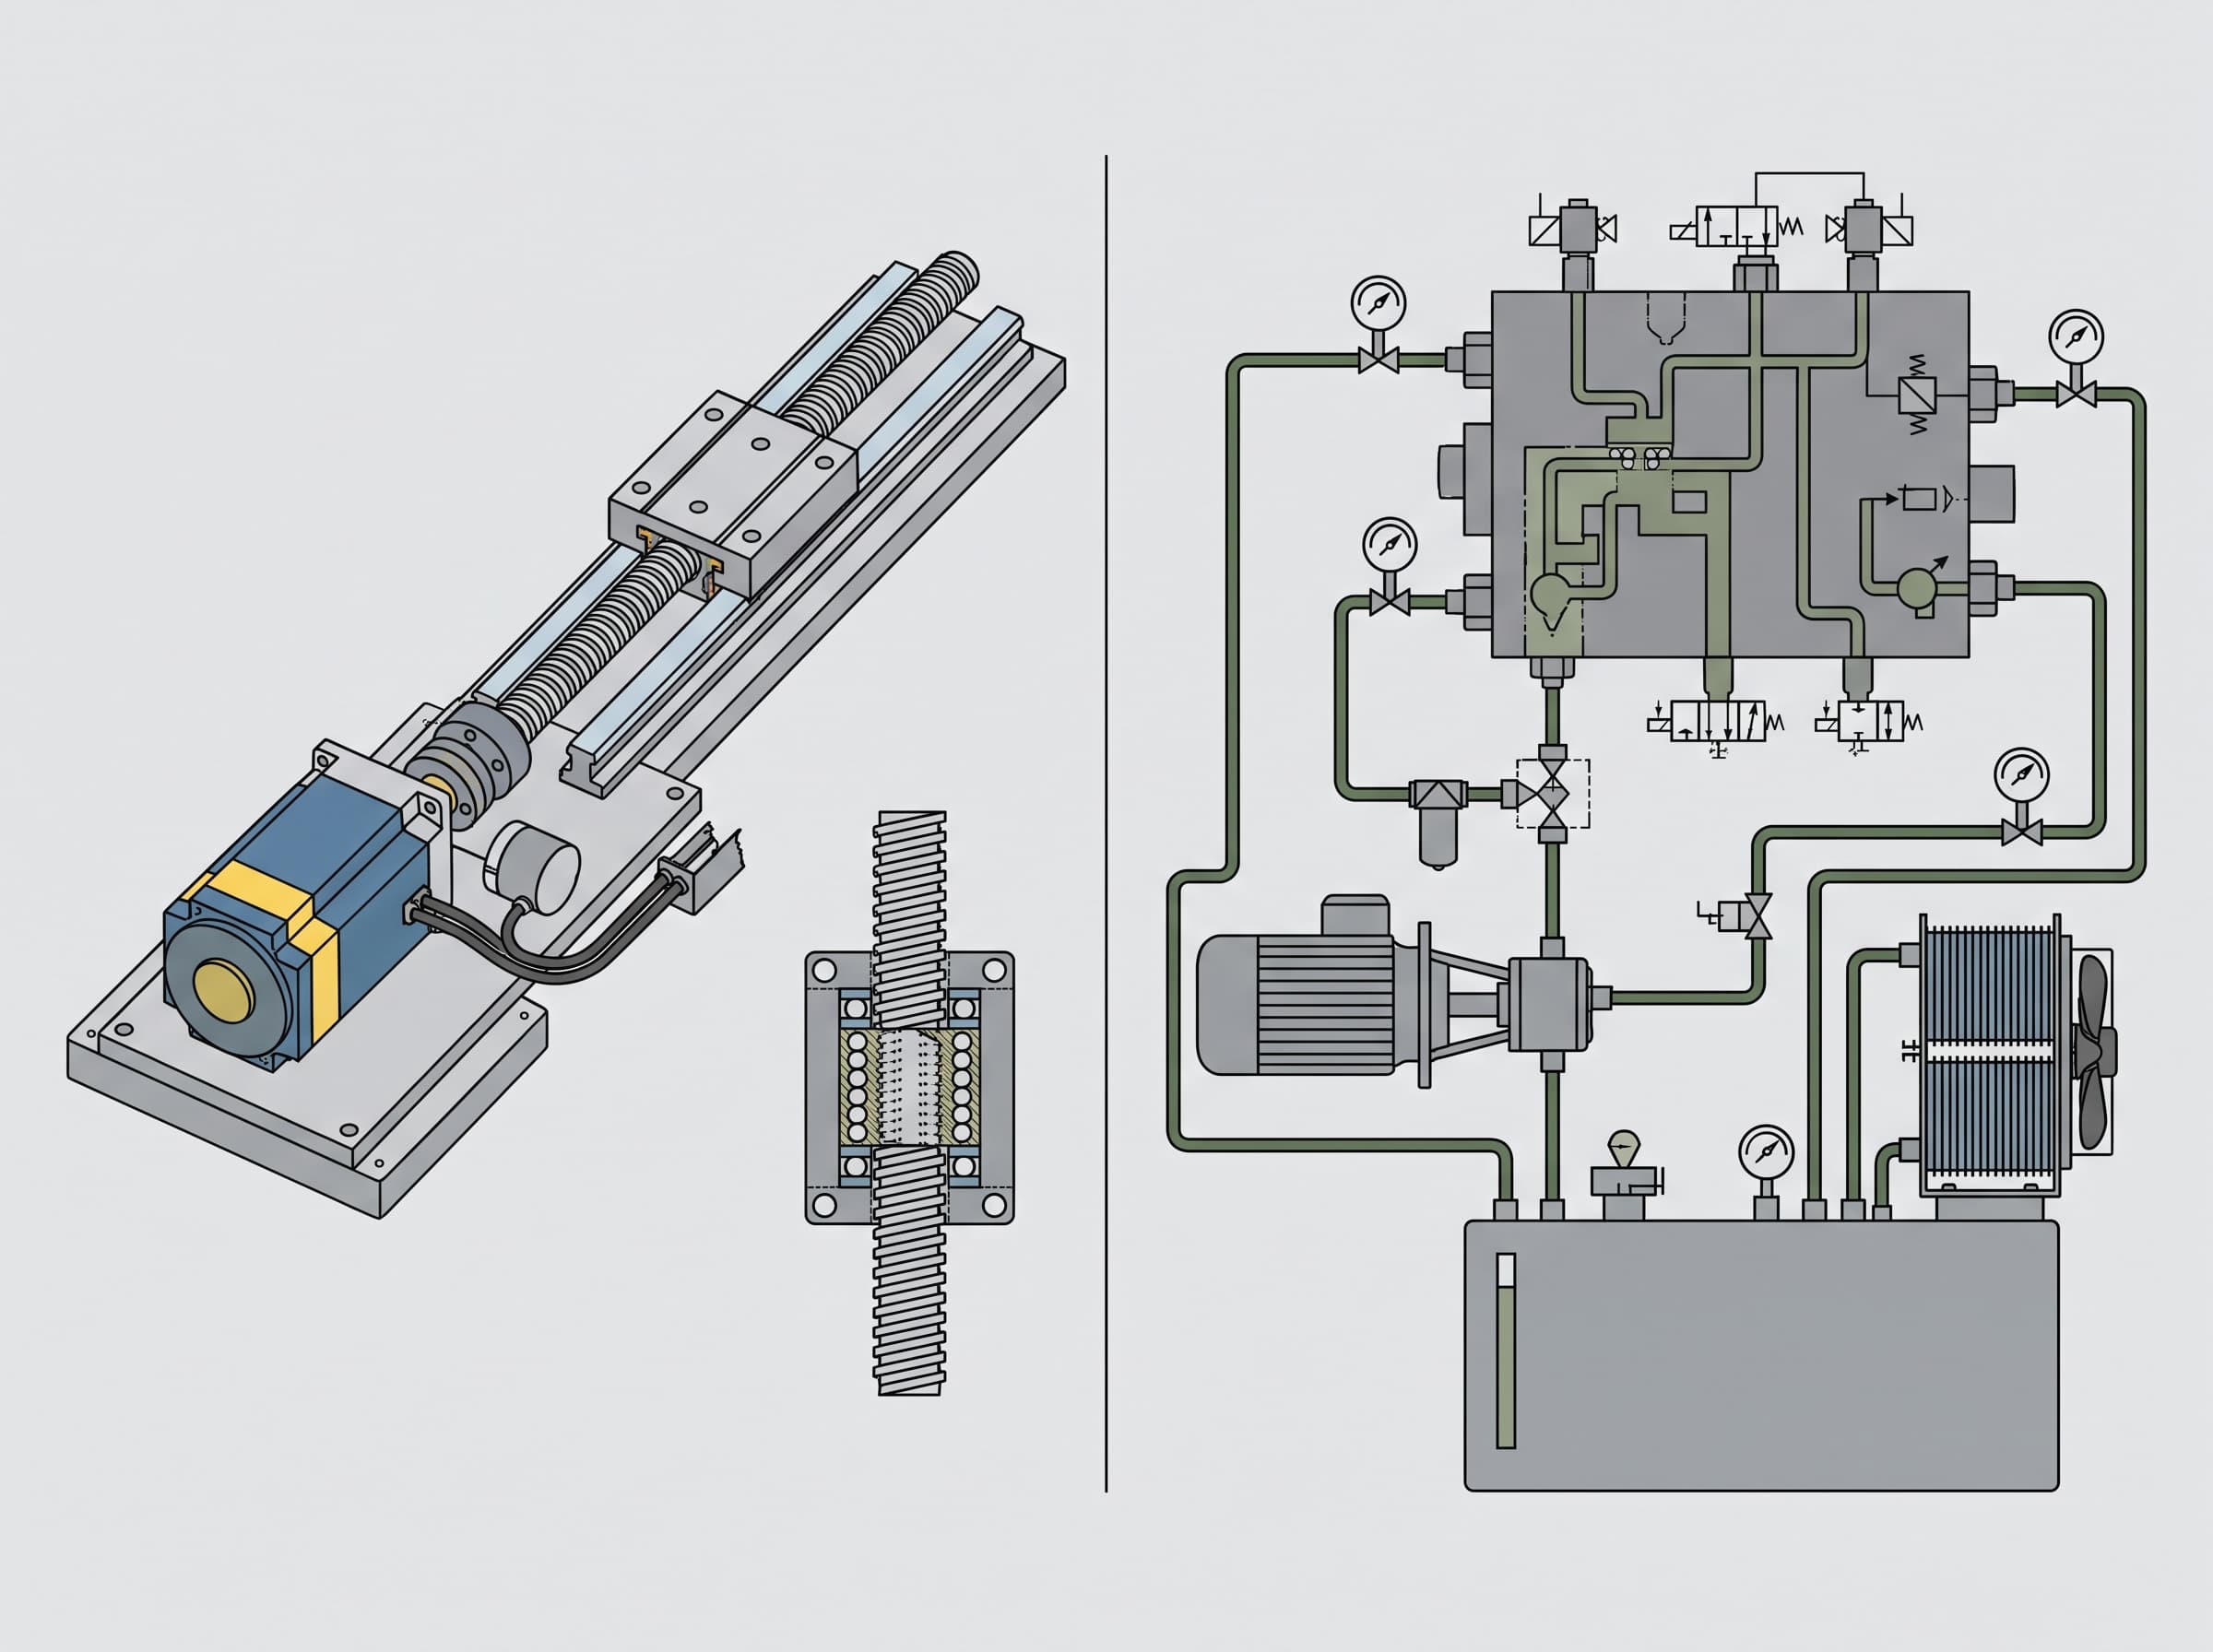
Secondary utility savings emerge from reduced heat dissipation requirements across plant cooling systems. In hydraulic architectures, mechanical energy from continuous fluid pressurization, pump shear, and proportional valve throttling degrades into thermal energy within the oil reservoir. This generated heat must be actively rejected through external heat exchangers connected to central cooling towers or process chillers. In contrast, all-electric ball screws and servomotors transfer negligible parasitic heat into process fluids, lowering auxiliary chiller electrical draw and eliminating dedicated oil cooler maintenance.
Hydraulic Maintenance, Fluid Disposal, and Consumables
Preventive maintenance schedules diverge significantly due to fluid management requirements. A 200-ton hydraulic machine consumes roughly 200 to 400 liters of specialized hydraulic oil, requiring periodic drain-and-refill intervals every 2,000 to 4,000 operating hours, alongside ongoing filtration element swaps1. Hydraulic cylinder and valve seals require replacement cycles around 3 to 5 years, with flexible pressure hoses needing replacement around 5 to 7 years1. In contrast, all-electric presses rely on localized automatic lubrication cartridges for toggle pins and tie-bar bushings, with mechanical ball screws and belts operating over extended 15,000 to 25,000 hour lifespans1.
Environmental compliance introduces administrative and handling requirements for hydraulic fluid storage. Under federal Used Oil Management Standards codified in 40 CFR 279.22, facilities generating waste hydraulic fluid must store used oil exclusively in containers or tanks maintained in sound structural condition without visible leaks4. Each storage container, aboveground tank, and underground fill pipe must be clearly labeled with the phrase 'Used Oil'4. While standard used oil intended for recycling is exempt from hazardous waste classifications under federal rules, generators must maintain clean handling procedures and contract EPA-registered used oil transporters for off-site recycling, creating administrative tracking and certified handling costs that all-electric plants bypass.
5-Year TCO Modeling: 200-Ton Press Run Scenarios
To illustrate the interaction between upfront procurement and operating expenses, consider a plant processing 300,000 kg of polypropylene annually over a continuous 6,000-hour production year. Using an industrial power cost benchmark of $0.095/kWh, the cumulative cost structure reflects standard mid-tonnage operational profiles across 5 years.
| Cost Category | Traditional Hydraulic | Servo-Hydraulic | All-Electric |
|---|---|---|---|
| Initial CAPEX (Landed) | $75,000 | $95,000 | $145,000 |
| Direct Power (5-Year) | $116,850 (0.82 kWh/kg) | $82,650 (0.58 kWh/kg) | $52,725 (0.37 kWh/kg) |
| Chiller Auxiliary Power | $26,000 | $18,000 | $4,500 |
| Hydraulic Oil & Consumables | $12,500 | $8,500 | $1,200 (Grease only) |
| Routine PM & Fluid Labor | $18,000 | $14,000 | $8,000 |
| Part Scrap Cost Differential | $15,000 (Base) | $8,000 | $3,000 |
| Estimated Resale Value (Yr 5) | -$15,000 | -$22,000 | -$38,000 |
| Total 5-Year Net TCO | $248,350 | $204,150 | $176,425 |
As modeled above, while the all-electric press carries a $50,000 CAPEX premium over the servo-hydraulic press ($145,000 versus $95,000), it delivers $56,725 in direct utility and maintenance savings across the 60-month evaluation period—combining $29,925 in direct power savings, $13,500 in reduced chiller load, $7,300 in avoided hydraulic fluid consumables, and $6,000 in routine labor reductions. When factoring in an additional $5,000 scrap reduction and a $16,000 higher residual resale value, the net 5-year financial benefit reaches $77,725, yielding an effective payback period against servo-hydraulics between 3.2 and 4.0 operating years under high-utilization conditions.
Operational Boundary Conditions and Failure Points
TCO calculations frequently fail when plants apply continuous multi-shift production assumptions to low-utilization facilities. If a press operates on a single shift under 2,000 hours per year, the annualized utility differential shrinks to less than $3,500 annually. Under such low duty cycles, the initial capital premium of an all-electric system may not amortize within a five-year equipment financing window, rendering servo-hydraulic presses more fiscally advantageous for short-run job shops or prototyping centers.
Machine scale and technical clamping requirements also dictate operational boundaries. For clamping forces exceeding 500 to 1,000 metric tons, the extreme load-bearing requirements make heavy hydraulic cylinders far more cost-effective to engineer than giant servomotors and multi-axis planetary roller screws. In heavy automotive exterior molding, structural pallet casting, or complex molds requiring multi-circuit core pulls, servo-hydraulic architectures remain the industry standard due to lower capital actuator costs and inherent fluid power density at high tonnages.
Frequently asked questions
Q. What is the typical payback period when upgrading from servo-hydraulic to all-electric?
A. For facilities operating across two to three shifts (5,000 to 6,000 hours per year) with industrial electricity rates between $0.09 and $0.12 per kWh, the payback period for the all-electric capital premium typically ranges from 3 to 4.2 years.
Q. How does hydraulic fluid compliance affect total ownership costs?
A. Under EPA 40 CFR 279.22, used hydraulic oil must be stored in structurally sound, non-leaking containers labeled 'Used Oil' and transferred via EPA-registered used oil transporters, adding filtration, recurring oil analysis, and documented recycling overhead over 5 years.
Q. When does a servo-hydraulic machine make more financial sense than an all-electric press?
A. Servo-hydraulic presses are financially preferable in low-duty-cycle facilities operating under 2,500 hours annually, applications requiring core-pull hydraulic sequences, or large-tonnage molding above 500 tons where all-electric machinery costs escalate drastically.
Sources
- All Electric Injection Molding Machine vs Servo-Hydraulic: A Side-by-Side Performance and Cost AnalysisSuccessor Plastic Machinery
- How Much Does an Injection Molding Machine Cost?- LIZHU Machinery Co., Ltd.Vertical Injection Molding Machine Factory
- Electric Power Monthly - Average Price of Electricity to Ultimate Customers by End-Use Sector (Table 5.6.A)U.S. Energy Information Administration
- 40 CFR 279.22 -- Used oil storageElectronic Code of Federal Regulations (eCFR)